We compile thousands of real estate transactions and monitor benchmark farms twice a year to provide the most comprehensive data on farmland values in our four-state area of Iowa, Nebraska, South Dakota and Wyoming. As part of a strategic alliance with Frontier Farm Credit, we just completed our first year of tracking land values in eastern Kansas.
Below is the average change in value, updated through December 31, 2015, for 71 benchmark farms:
| Six Month
| One Year | Five Year | Ten Year |
Iowa (21)
| -1.63% | -6.31% | 45.05% | 156.87% |
Kansas (7)
| 1.87% | 4.87% |
|
|
Nebraska (18)
| 0.22% | -2.43% | 95.04% | 243.24% |
South Dakota (23)
| 0.17% | 0.98% | 101.24% | 239.83% |
| Wyoming (2) | 2.51% | 9.47% | 25.12% | 62.73% |
The significant decline in farmland prices anticipated by some forecasters since the peak in commodity prices in 2013 has not fully developed, though the impact of lower profit margins is reflected in adjustments to the market for both cropland values and cash rental rates.
While we haven’t seen cropland values drop at the same pace as profit margins and commodity prices, there is a heightened attention by producers to their cash flows. Farmers also are keenly aware of the need to align their cost of production with corn prices in the range of $3.25 to $4.25 for the foreseeable future, barring a drought or some other unexpected demand or supply-side event. Fortunately, many farmers are in a strong financial position, resulting from previous record profit years.
Our cropland value monitoring also indicates that the range of decline in cropland values is wide, with some regional areas experiencing little to no change, and others reflecting market declines of 20 to 30 percent.
However, I would caution that averages can be somewhat misleading. Specific regional influences, such as the quality of the cropland and local interest, can play a big part in the price received by a seller.
Here is a summary of the changes in land values through the end of 2015:
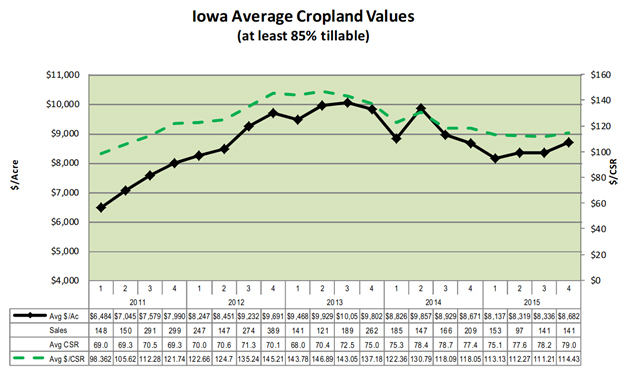
Iowa – The average price of $8,682 an acre in the fourth quarter of 2015 was comparable to values in the previous year, but still 14 percent below peak 2013 prices. The average quality of purchased land also improved during 2015, indicating the uptick in per-acre price was driven more by quality than the market. The highest dollar per-acre sale during the fourth quarter was $18,100. However, only 18 percent of all fourth quarter sales exceeded $10,000 per acre. This was down from 26 percent in 2014.
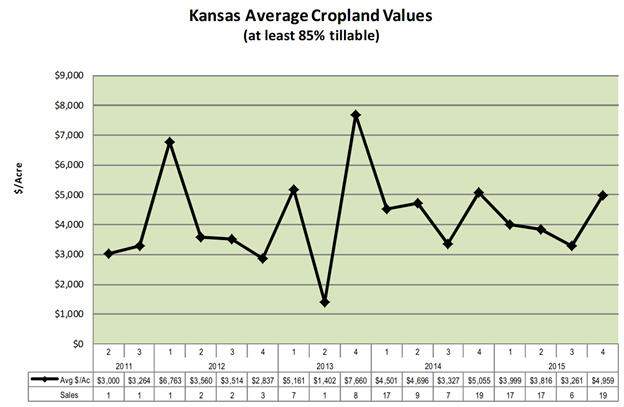
Eastern Kansas – Cropland values dipped during much of the year, but rebounded to levels comparable to the fourth quarter of 2014. The average per-acre price in the eastern part of Kansas was just shy of $5,000 at the close of 2015.
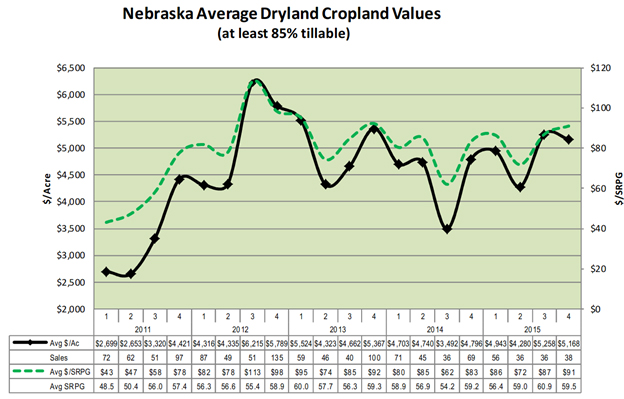
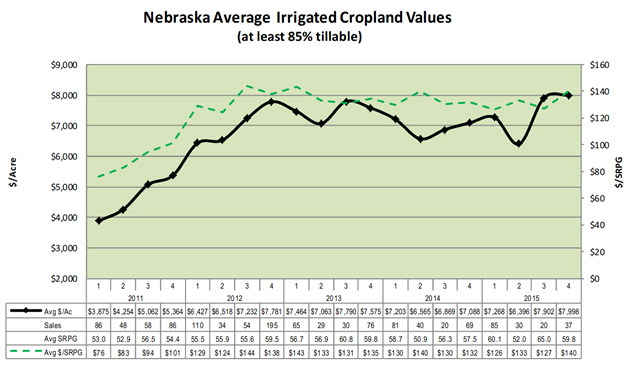
Nebraska – Average benchmark values held steady in the last half of 2015 and declined 2.4 percent for the year. Five of 18 farms increased in value, while three showed no change. The farms that decreased in value declined an average of 4.2 percent.
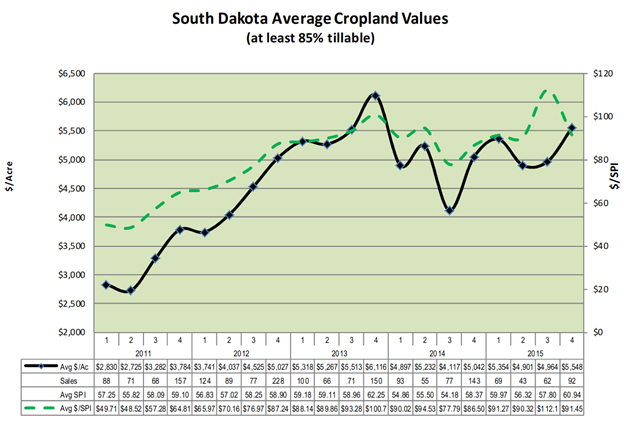
South Dakota – Prices for unimproved cropland rose in the fourth quarter of 2015, finishing the year at an average per-acre price of $5,500, second only to the 2013 record high of roughly $6,100 an acre. The number of sales in 2015 declined 28 percent compared to 2014.
Wyoming – Completed sales were down 52 percent compared to 2014, making it difficult to identify trends from a small and diverse base of transactions. Sales that did occur, however, were for an average per-acre price of $1,000 in the fourth quarter of 2015, down from the $1,400 average that held steady during the previous four quarters.

