Terrain® is our service for timely insights on topics and trends impacting agriculture, delivered by a team of specialized economic and agriculture analysts. Additional Terrain articles can be found at TerrainAg.com.
Author: Jessica Groskopf
Report snapshot
Situation
Access to farm bill program payments varies significantly because payments are tied to base acres, not planted acres.
Outlook
As cropping patterns continue to evolve, and base acres remain the same, potential farm payments will not meet the needs of farms with higher production risk and lower base acres.
Impact
Farms with relatively few base acres can benefit from a diversified risk management approach that includes crop insurance, working capital, marketing strategies, or other risk management tools.
Two farms with similar cropland acres can receive substantially different levels of government assistance.
In September, the USDA projected 2026 net cash farm income to be up 0.4% to $176.4 billion, citing increased direct government payments as a key driver. It is estimated that farmers will receive $47.4 billion in direct government payments, with 55% coming from supplemental and ad hoc disaster programs, 33% from farm bill programs such as Agriculture Risk Coverage (ARC) and Price Loss Coverage (PLC), and 11% from conservation programs.
Government payments are calculated differently across programs. Supplemental and ad hoc disaster programs, such as the Farmer Bridge Assistance Program, were based on planted acres. However, ARC and PLC payments, which are a cornerstone of government support, are tied to a farm's base acres. Because base acre shares vary widely among farms, so does access to ARC and PLC payments. As a result, two farms with similar cropland acres can receive substantially different levels of government assistance.
Federal farm programs are one tool available to farmers to manage their risk. But farms in the riskiest regions actually have fewer base acres qualifying for ARC and PLC payments. These farms have important, and different, considerations for crop insurance, financial management and commodity marketing strategies.
The base acre disparity
Base acres were established as part of farm program reforms in the 1980s and 1990s to decouple government payments from current production. (When the World Trade Organization formed in 1995, rules were set to limit the influence of agricultural policy on production.) The 2014 farm bill introduced ARC and PLC, designed to provide limited support when commodity prices or revenues fall below certain thresholds. It also allowed farm owners to update the commodities assigned to their base acres. The total number of base acres has changed little since the base acre system was developed. The One Big Beautiful Bill Act adds 30 million base acres (11%) beginning in 2026, though county-level allocation data are not yet available.
Because of how base acres were established, the number of base acres varies widely by farm. Farms that did not plant covered commodities during the period used to establish base acres generally received no base acres. Meanwhile, farms that have since shifted acreage away from crop production may now have base acres that exceed their current planted acreage.
To illustrate how base acre allocation varies across the U.S., Map 1 shows each county's base acre share. Base acre share is calculated as total base acres divided by total cropland acres for the county. A county base acre share of 100% indicates approximately one base acre for every cropland acre, while lower values indicate a smaller share of cropland eligible for ARC or PLC payments. Although county averages provide a useful indication of regional patterns, base acre shares can vary considerably among farms within the same county.
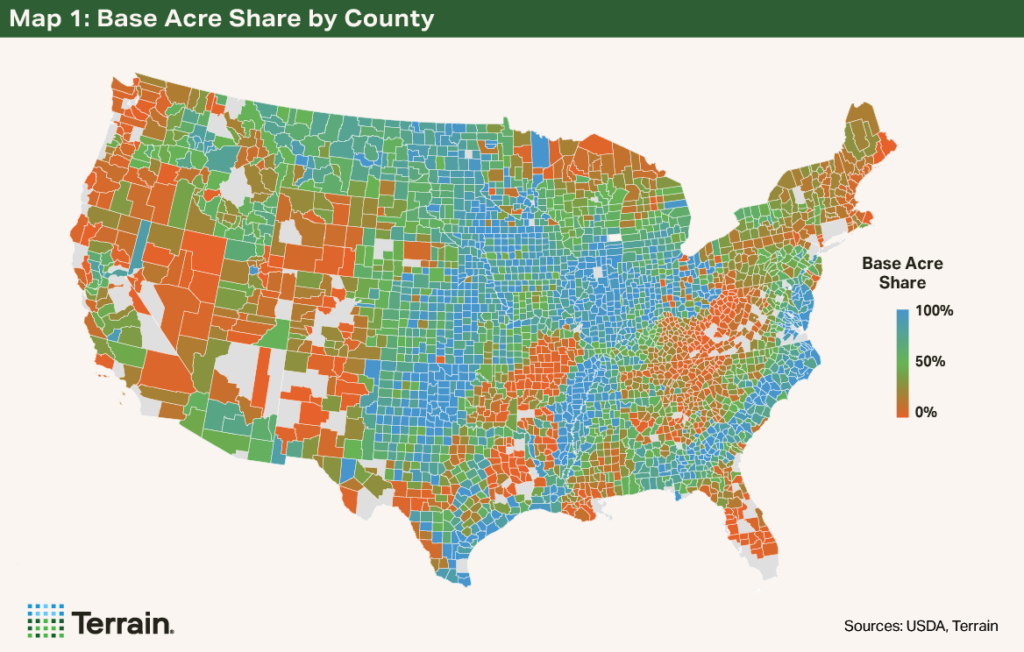
Map 1 shows that counties in the corn and cotton belt have above or near 100% base acre share. In these areas, program crops were more dominant during the establishment of the base acre system. As production moves farther from these regions, historical crop rotations included fallow and/or were more diverse, planting fewer covered commodities. Therefore, base acre share tends to decline.
Measuring production risk across U.S. agriculture
Measuring risk is challenging because no single factor determines whether a farm is risky. Weather, yield variability and regional conditions all contribute to risk.
For this analysis, the average county-level Risk Management Agency loss ratio from 1989 to 2025 was used as a long-term proxy for risk. The loss ratio is calculated as indemnities divided by premiums and reflects the historical frequency and severity of insured losses. While not a pure measure of production risk, long-run loss ratios provide a useful indicator.
To simplify these data, counties were ranked by their average crop loss ratio and divided into five equal-sized groups, with each group containing approximately 20% of U.S. counties. Table 1 reports the average loss ratio for each group, and Map 2 shows the distribution across the U.S.
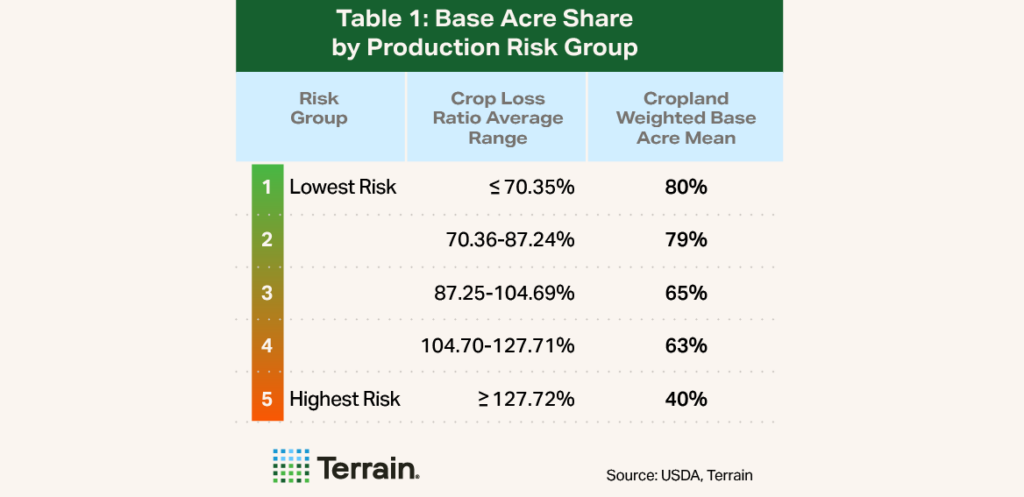
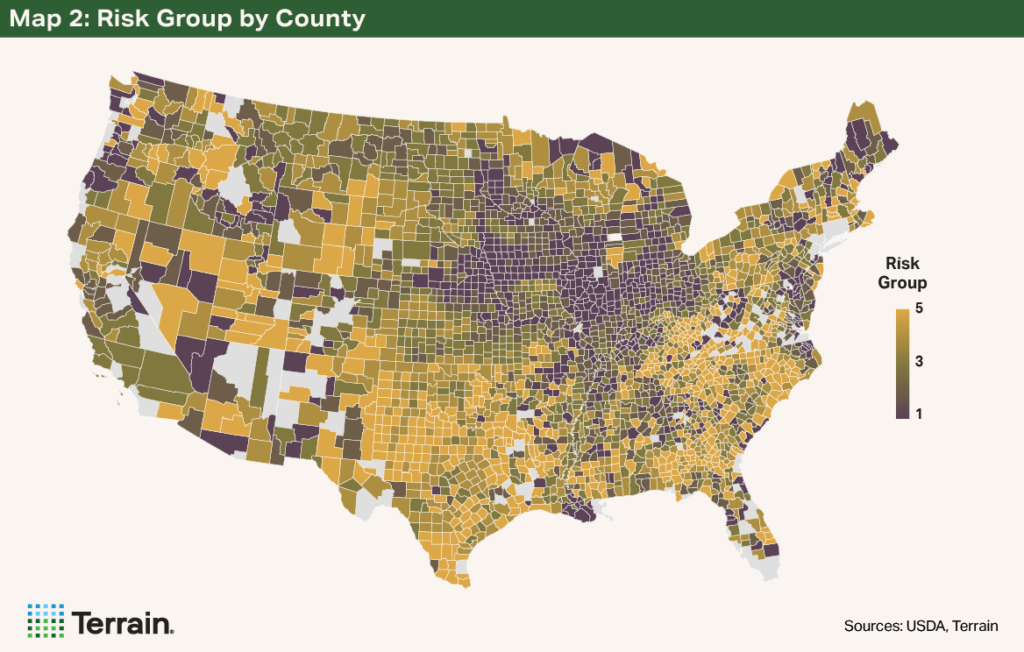
Comparing the two maps reveals a notable geographic mismatch. Counties with the largest base acre shares are concentrated in the corn belt, while counties facing some of the highest levels of production risk often have substantially lower base acre shares.
Counties facing some of the highest levels of production risk often have substantially lower base acre shares.
These visual conclusions are confirmed in Table 1, where the cropland-weighted base acre means are calculated from each of the five risk groups. As crop production risk increases, base acre share declines. Counties in the highest-risk group have a cropland-weighted base acre share of just 40%, compared with about 80% among counties in the lowest-risk group.
Farms with relatively few base acres, particularly those located in higher-risk production areas, may need to think differently about risk management.
Low base acre share and high risk
Base acre share can have important implications for farm profitability. During periods of low commodity prices, ARC and PLC payments can provide meaningful support to net cash farm income. Farms with a low base acre share may have less access to these payments than neighboring operations. As a result, two farms with similar cropland acres can receive substantially different levels of support from the farm bill safety net.
What does this mean for farmers? Farms with relatively few base acres, particularly those located in higher-risk production areas, may need to think differently about risk management.
Find the best crop insurance coverage
First, crop insurance becomes even more important. Unlike ARC and PLC, crop insurance provides protection for more commodities, covers planted acres, responds to individual losses, provides protection against yield or revenue declines, and provides payments in a more timely manner. Although crop insurance is more expensive in higher-risk areas, there is a higher probability of indemnity. Farmers should carefully consider higher coverage levels, discuss differences in insurable units, as well as look into supplemental coverage options in order to find the best coverage for their individual needs.
Prioritize balance sheet strength
Second, robust financial management is non-negotiable. Balance sheet strength becomes particularly valuable when production risk is elevated. A strong financial position, including higher working capital and a lower debt-to-asset ratio, provides flexibility to withstand poor yields, volatile markets, or multiple challenging years in a row. Farmers should work with their Farm Credit lender to frequently stress-test their income and balance sheet to better understand their liquidity and solvency positions.
Understand marketing approaches
Finally, marketing strategies may need to reflect the realities of individual production risk. Farmers in higher-risk regions often have less certainty about final production and may approach forward contracting differently than those in more stable growing environments. Capturing attractive prices remains important, but so does avoiding commitments that become difficult to fulfill when yields disappoint. Therefore, farmers in this region need an enhanced understanding of pure commodity trading options to augment their cash sales.
Base acres should not drive management decisions on their own. However, they are one component of an operation's overall risk management framework. Understanding a farm's base acre position, and how that position compares with the production risks it faces, can help farmers make more informed decisions about insurance coverage, financial position and marketing. When margins tighten, those differences can become increasingly important.
Terrain® content is an exclusive offering of AgCountry Farm Credit Services, Farm Credit Services of America, Frontier Farm Credit, and American AgCredit.
While the information contained in this site is accurate to the best of our knowledge, it is presented “as is,” with no guarantee of completeness, accuracy, or timeliness, and without warranty of any kind, express or implied. None of the contents on this site should be considered to constitute investment, legal, accounting, tax, or other advice of any kind. In no event will Terrain or its affiliated Associations and their respective agents and employees be liable to you or anyone else for any decision made or action taken in reliance on the information in this site.