 Stress tests have wide application. Doctors use a stress test to assess the strength of your heart and susceptibility to heart attack. A metal manufacturer wants to know how much stress metal parts can take before breaking. Businesses apply stress testing to figure out the point at which the business may run out of operating cash. Stress tests really hit the headlines during the financial crisis in 2008 when they were applied to banks. More recently, they have gained use in agriculture.
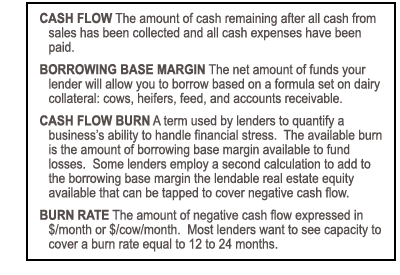
Lenders want to have an idea of how long an operation’s borrowing base margin can sustain a given negative cash flow. In other words, at what point does the operation run out of its capacity to borrow?
One measure some dairy lenders use as a gauge for burn is the worst dairy year in recent memory -- 2009. That year, most dairies lost about $2.50/cwt or $530/cow. So a 2,000-cow dairy needed $1,060,000 of available cash sources (“burn capacity”) to cover losses.
When a 2009 scenario arises, it is difficult to forecast the end of the cycle. So if you entered 2009 with $530/cow of burn, your lender probably started to ask a lot of questions before you borrowed the last available dollar. So, ideally, lenders want to see “burn capacity” north of $530/cow.
Since 2009, on average, most dairy operations have been very profitable and have increased their burn capacity dramatically -- by a total of more than $1,500/cow, with almost half of this gain coming in 2014. The average level of burn capacity is three to five times what is was coming out of 2009, assuming no major expansion during this time period to funnel part of surplus borrowing capacity into more cows and facilities. There is a record amount of liquidity and “burn capacity” in the industry today. If another 2009 scenario unfolded, most dairies could readily work through this downside scenario.
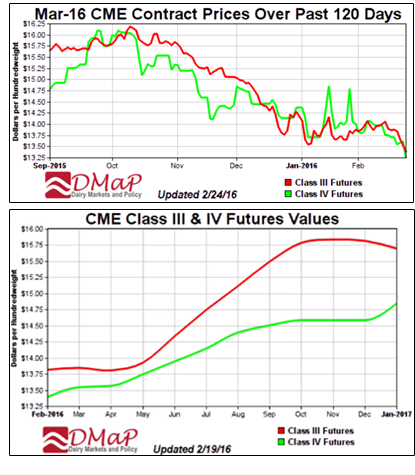 However, with Chicago Mercantile Exchange milk futures down from $16 last October to $13 recently (see chart) and USDA forecasting the 2016 all-milk price at $15.30/cwt., down from $17.08 in 2015, it isn’t a bad idea for dairies to do their own stress tests. A common approach is to develop a “most likely” cash flow projection and then calculate results under various negative influences to see how much risk your dairy can handle. That allows you to proactively identify steps to take before financial stress mounts.
The simplest version is to consider anticipated gross milk sales compared with feed costs. Milk revenue represents more than 90% of income and feed costs typically represent 45 to 60 percent of expenses, so these represent the biggest factors in dairy profitability.
The following example illustrates one representative outcome, given USDA’s projections for 2016 prices, a downside scenario reflecting a 6 percent increase in feed costs and a 6 percent drop in milk price from USDA’s initial numbers. The worst-case scenario assumes roughly 10% adverse changes feed costs and milk price.
|
|
2015
|
Projected
2016
|
Downside
scenario 2016
|
Worst-case
scenario 2016
|
|
Net milk price
|
$17.00
|
$15.30
|
$14.40
|
$13.75
|
|
Other income
|
$0.50
|
$0.50
|
$0.50
|
$0.50
|
|
Feed cost
|
$9.00
|
$8.55
|
$9.54
|
$9.90
|
|
All other costs
|
$7.00
|
$7.00
|
$7.00
|
$7.00
|
|
Net cash flow
|
$1.25
|
$0.25
|
($1.64)
|
($2.65)
|
|
|
|
|
|
|
|
Production (cwt.)
|
826,000
|
826,000
|
826,000
|
826,000
|
|
Cash-flow
|
$1,032,500
|
$20,500
|
($1,354,640)
|
($2,188,900)
|
|
Breakeven milk price
|
$15.75
|
$15.05
|
$16.04
|
$16.40
|
|
Breakeven feed cost
|
$10.25
|
$8.80
|
$7.90
|
$7.25
|
As you consider risks your operation may face, you also may want to include stress tests of reduced production per cow, increases in non-feed operating costs, increased culling rate and so on. Once you have completed a cash-flow stress test, you can look at the impacts of those scenarios on equity and capital. How much capital or borrowing capacity does the dairy have to cover the losses in the event of less-than-expected results? In addition to working capital, three sources may fund the losses: borrowed funds, sale of assets or cash from outside the business.
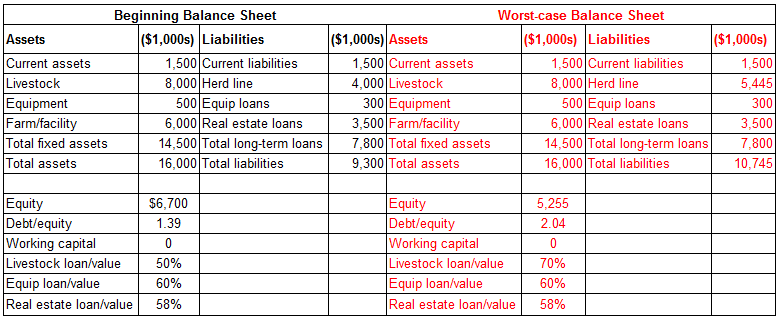
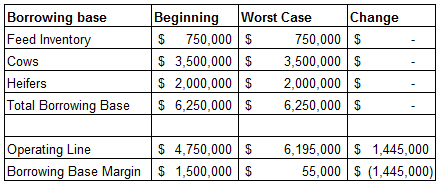
The example below assumes there is no working capital available and loans against equipment and land are close to their maximum. As a result, the cash-flow shortfall is dealt with through borrowing an additional $1,445,000 on the herd, boosting loan-to-value from 50 percent to 70 percent.
Risk Mitigation
USDA’s Farm Service Agency recently released the results of last fall’s sign-up for the 2016 Margin Protection Program: More than 23,000 dairy operations representing 162.3 billion pounds of milk enrolled. Based on USDA’s January projection that 211.8 billion pounds of milk will be produced this year, that means 77 percent of the supply is enrolled, slightly lower than last year’s 80 percent. On average, operations chose to protect 88 percent of their MPP-Dairy production history, so more than two-thirds of the nation’s milk will be eligible for payments if prices fall precipitously.
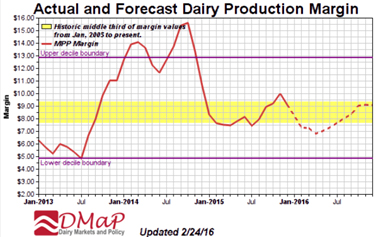 They would need to do that to prompt payments: More than 141 billion pounds is covered at only the $4 level. The next most chosen level was $6, on 9.5 billion pounds, followed by $6.50 at 5.8 billion and $5 at 3.4 billion.
Since January 2005, the historic middle third of margin values has been between about $7.60 and $9.90 and in the past three years, it has not fallen much below $5.
However, the MPP can be used in conjunction with exchange-traded futures and options. As the first chart illustrated, it was possible to hedge March 2016 milk price in the $16 range, which should be profitable for most dairies.
For More on Stress Testing
You can find a stress-test calculator at the Dairy Markets and Policy website: http://dairymarkets.org/MPP/Tool/. Although it is designed to work with the Margin Protection Program, it is useful for general stress testing as well. For an explanation and link to the 2016 calculator, see http://dairymarkets.org/PubPod/Pubs/DG15-01.pdf. The National Milk Producers’ Federation also offers an MPP calculator: http://www.futurefordairy.com/mpp-calculator.
Given the volatile nature of the dairy business, it is worthwhile to know your breakeven milk price and your cost of production. Stress tests help a dairy see where the operation is vulnerable and allows dairy managers to assure that they can plan for adequate liquidity/”burn capacity” to weather a dairy industry down cycle. The greatest benefit of stress testing is for dairies operating with low borrowing base margins or planning a major expansion. Expansion requires a significant amount of cash/borrowing base margin. The combination of lenders requiring a cash contribution of 35 percent to 40 percent of a new dairy project cost and the variance between cow prices in excess of $2,000/cow and lending value of about $1,000/cow significantly drains borrowing base margin and puts a dairy into a far less liquid and more vulnerable financial position. A 3,000 cow enclosed dairy has a total investment of over $20 million requiring about $8 million of cash/borrowing base margin to get the dairy started.
On a final note, the Goliath storm that hit the Southwest is a good example of a stress test for producers. Producers in the Southwest are learning about the impact on cash flow of many simultaneous factors, including operating with fewer cows milking, lower milk production/cow, high somatic cell counts, and a low $14/cwt net milk price. Most producers are drawing upon their borrowing base margins and reducing their available burn to get through this unforeseen event. Most have adequate burn capacity to get through this issue, however, it will take some time and cash/borrowing base margin to get back to normal operations.
Opportunity Awaits
As you consider stress testing for growth or risk management, consider attending the Central Plains Dairy Expo in Sioux Falls, South Dakota, March 29 to 31, 2016. This is an opportunity to network with other dairy producers and visit the trade show. Farm Credit Services of America also is sponsoring an outlook session with Sarina Sharp, a leading market analyst and dairy risk manager, on the afternoon of March 30. Most of the Expo is free. For more details and to register in advance: http://www.centralplainsdairy.com/

