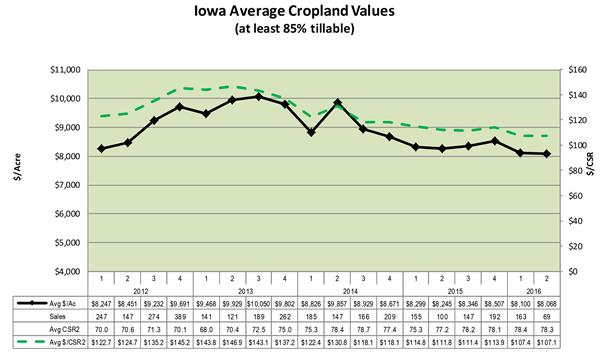
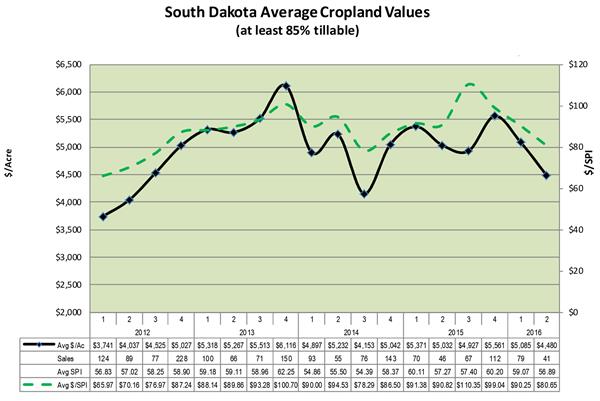
A steady but gradual decline in farmland values continued into the first half of 2016 across the states served by Farm Credit Services of America (FCSAmerica). Iowa has experienced the greatest decline in average farm values – about 20 percent since the market’s 2013 peak. Nebraska and South Dakota farmland has declined by a more modest 12.5 and 4.8 percent respectively during the same period.
Demand for farmland also is down. Public land auctions declined 8 percent in the first six months of 2016 compared to the previous year. This percentage includes public auctions in Iowa, Nebraska, South Dakota and Wyoming, as well as Kansas, where FCSAmerica works in alliance with Frontier Farm Credit to monitor farmland values.
Across the five states, lower farm incomes and per-acre profitability continue to put downward pressure on farmland values. Unlike last year, when a strong livestock market led to increased demand for pastureland, values on both pasture and cropland are generally down in 2016. This reflects lower commodity prices for grain as well as cattle.
|
Twelve-Month Change in Value
|
|
State
|
Cropland
|
Pasture
|
|
Iowa
|
-5.7%
|
-1.8%
|
|
Kansas
|
-0.9%
|
0.8%
|
|
Nebraska
|
-4.7%
|
-2.2%
|
|
South Dakota
|
-3.2%
|
-3.1%
|
|
Wyoming
|
1.1%
|
20.8%
|
The fall in commodity prices has outpaced the rate of decline in farmland values and FCSAmerica continues to forecast a soft landing for agriculture as the current market correction brings supply and demand back in line.
Below is the average change in benchmark farm values, with the number of benchmark farms appraised in each state noted in parenthesis:
|
State
|
Six Month
|
One Year
|
Five Year
|
Ten Year
|
|
Iowa (21)
|
-4.0%
|
-5.6%
|
19.6%
|
139.4%
|
|
Kansas (7)
|
-2.0%
|
-0.2%
|
|
|
|
Nebraska (18)
|
-4.5%
|
-4.4%
|
68.5%
|
212.3%
|
|
South Dakota (23)
|
-3.6%
|
-3.5%
|
79.1%
|
208.3%
|
|
Wyoming (2)
|
7.8%
|
10.6%
|
35.8%
|
67.7%
|
Trends in farmland values by state include:
IOWA: Fourteen benchmark farms declined in value during the first six months of 2016, while seven showed no change. The average sale price for cropland has reached a 5-year low, but average land quality continues to be at historically high levels.
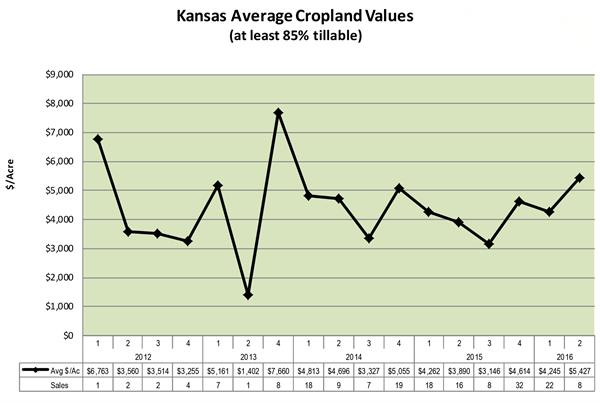
KANSAS: Two benchmark farms increased in value, three were unchanged and two declined in value. Benchmark farms in Kansas were appraised for the first time in 2015. As a result, historic data is unavailable. Much of the increase in cropland prices seen in the second quarter of 2016 was attributable to two farmland sales.
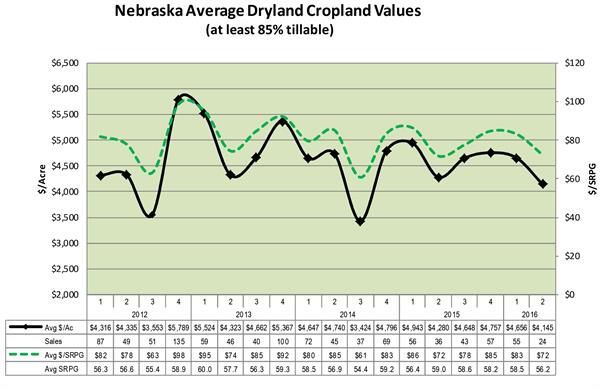
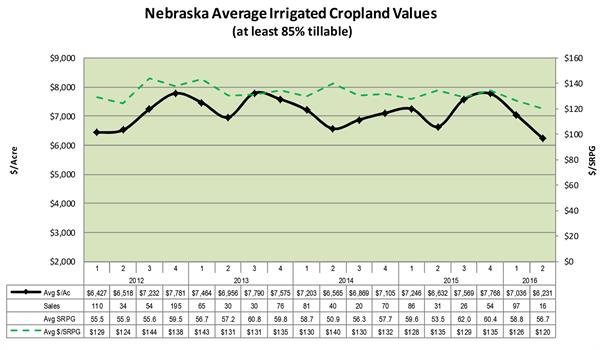
NEBRASKA: Two benchmark farms increased in value, four were unchanged and 10 declined an average of 7.5 percent. Lower sale prices for dry and irrigated cropland were due, at least in part, to deterioration in the average soil quality of land sales.
SOUTH DAKOTA: While three benchmark farms increased in value, eight lost value. As a percent of total sales, public auctions have grown significantly, increasing 65 percent from a year ago.
WYOMING: A benchmark farm comprised of cropland saw no change in value in the first half of 2016, while the second, a pasture unit, increased in value 15.6 percent. Farmland sales were too few to accurately discern any trends.

